MECO4114 Research Methods
Week 04 Digital Research Methods
Acknowledgement of Country
I would like to acknowledge the Traditional Owners of Australia and recognise their continuing connection to land, water and culture. The University of Sydney is located on the land of the Gadigal people of the Eora Nation. I pay my respects to their Elders, past and present.
Who am I
Academic Background
- PhD in Government & International Relations (University of Sydney, 2017)
- Senior Lecturer in the School of Government and International Relations, School of Social and Political Sciences
- Co-Director, Centre for AI, Trust and Governance and Director of the Computational Social Science Lab
Research Focus
- Intersection of digital technologies and political participation, and democratic governance
- Computational methods for understanding information systems and their societal and political impacts
Teaching: GOVT6139 Research Design (S2), SSPS4102/6006 Data analytics (with R, S1), GOVT3901 Digital Politics (S2) and CISS6022 Cybersecurity (S1).
You can reach me at francesco.bailo@sydney.edu.au.
Observing behaviour
This section is largely based on Chapter 2 of Salganik (2018).
Three ways to collect data
Whatever the subject of your research, there are mainly three ways to collect data:
- Running experiments
. . .
- Asking questions
. . .
- Observing behaviour \(\leftarrow\)
. . .
- Observational data are collected without interfering with either
- the subject of the investigation or
- the environment of the subject of the investigation.
The primordial way of investigating
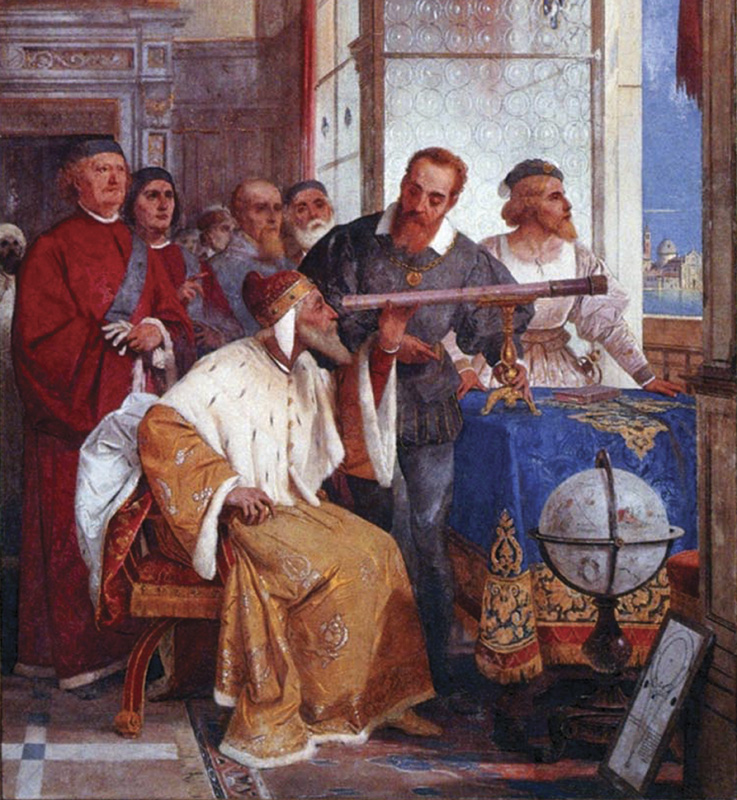
Observation of something or somebody is the primordial way of investigating what we are interested in (and usually the beginning of an investigation).
Using instruments and sensors to observe and record what we observe is not new.
What is new is the number of instruments and sensors that monitor and record human behaviour.
Big Data
The combination of flow and the stock of data produced by these instruments and sensors is often called Big Data.
Big data are big on three dimensions:
- Volume
- Variety
- Velocity
Examples of Big Data
So… can you think of any example of big data or source of big data?
Big data are not only data generated by the online activity of users and are not only created by companies.
Big data are generated online and offline every time a sensor records a human behaviour.
Big data are created by companies and governments.
Big Data: Companies and Governments
“Big data are created and collected by companies and governments for purposes other than research. Using this data for research therefore requires repurposing.” (Salganik, 2018, p. 14)

\(\neq\)

Ten characteristics of Big Data (1/2)
According to Salganik (2018), Big Data shares ten characteristics.
Big Data are big: Rare events, heterogeneity, small differences. But how data were created?
Big Data are always-on: Unexpected events and real-time estimates. But the systems that collected the data are constantly changing (see drifting later)!
Big Data are nonreactive: Measurement is less likely to change behaviour. But a social desirability bias persists.
Big Data are incomplete: No demographic information, no information on behaviour on other platforms, and no data to operationalise theoretical constructs (e.g. “intelligence”).
Big Data are inaccessible: Access is controlled and conditional.
Ten characteristics of Big Data (2/2)
Big Data are non-representative: Data do not come from a probabilistic random population sample.
Big Data are drifting: Population drift, behavioural drift, system drift. Systems keep changing all the time!
Big Data are algorithmically confounded: Engineering choices impact user behaviours. Also, performativity issues.
Big Data are dirty: Dirty data can be created unintentionally or intentionally (e.g. bots).
Big Data are sensitive: The potential sensitivity of the data is always difficult to assess.
Network analysis
A very short introduction
[S]ocial network analysts argue that causation is not located in the individual, but in the social structure. While people with similar attributes may behave similarly, explaining these similarities by pointing to common attributes misses the reality that individuals with common attributes often occupy similar positions in the social structure. That is, people with similar attributes frequently have similar social network positions. Their similar outcomes are caused by the constraints, opportunities and perceptions created by these similar network positions. (Marin & Wellman, 2011, p. 13)
Network visualisation and adjacency matrix
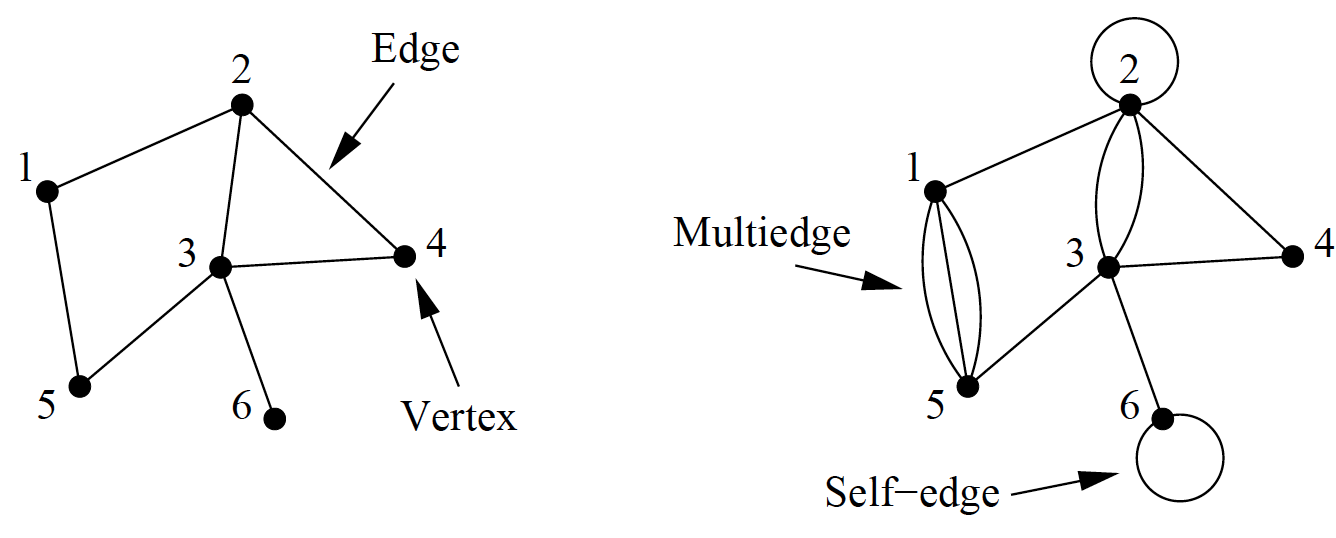
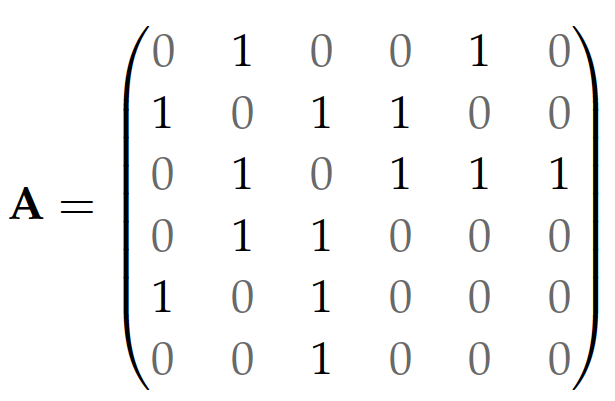
Directed networks
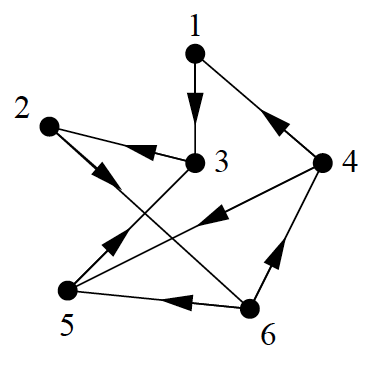
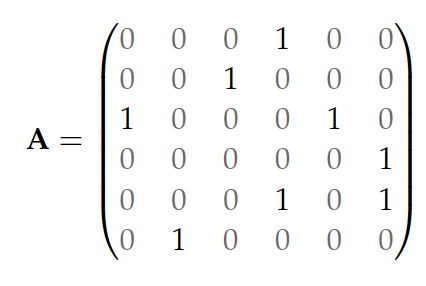
Network measures
- Degree of a vertex: number of connections
- Authority of a vertex: number of important connections
- Closeness of a vertex: mean distance to other vertices
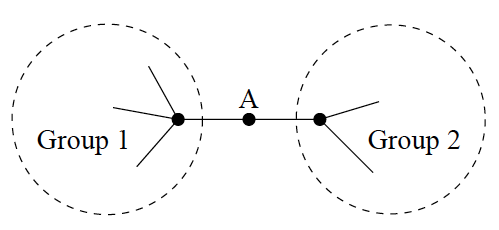
- Betweenness of a vertex: extent to which a vertex lies on paths between other vertices
- Group of vertices
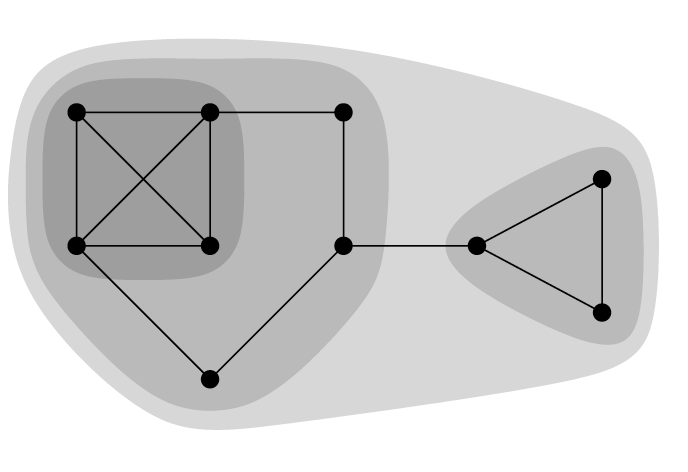
Network measures (continued)
- Transitivity of edges: Alice friend of Bob friend of Cat friend of Alice
- Reciprocity of edges: Alice friend of Bob friend of Alice
- Similarity of vertices: extent to which the neighbourhood of vertices is similar
- Homophily of vertices: tendency to associate with similar vertices
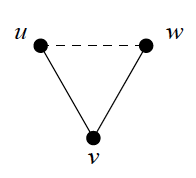
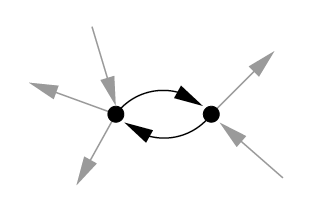
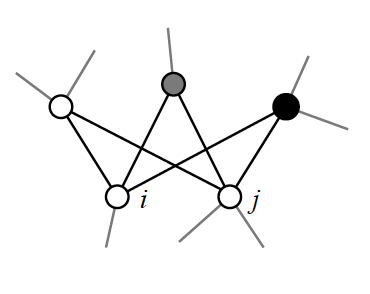
Example: Friendship network
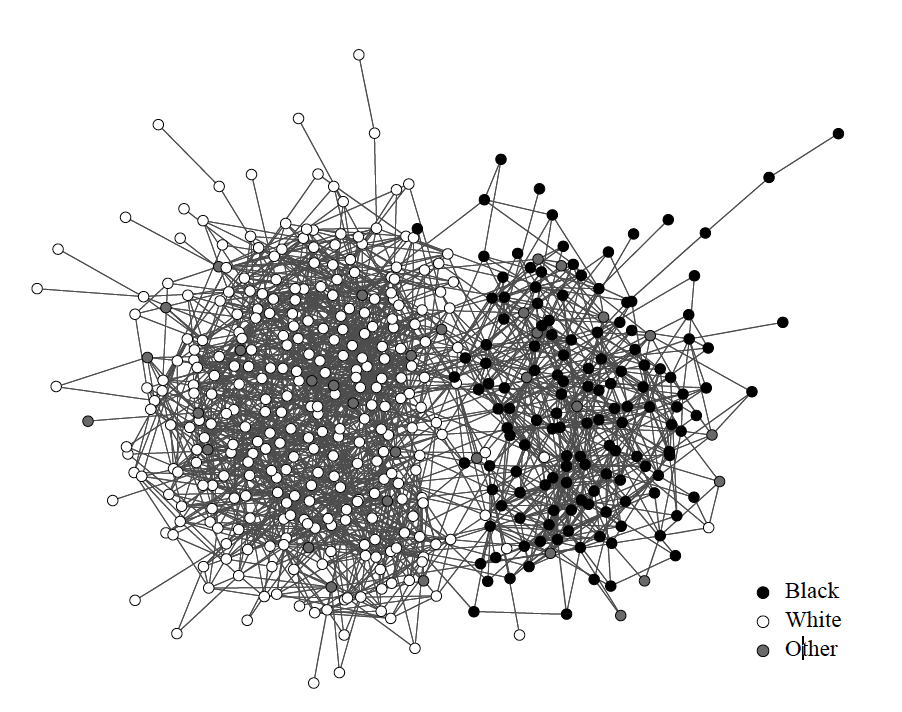
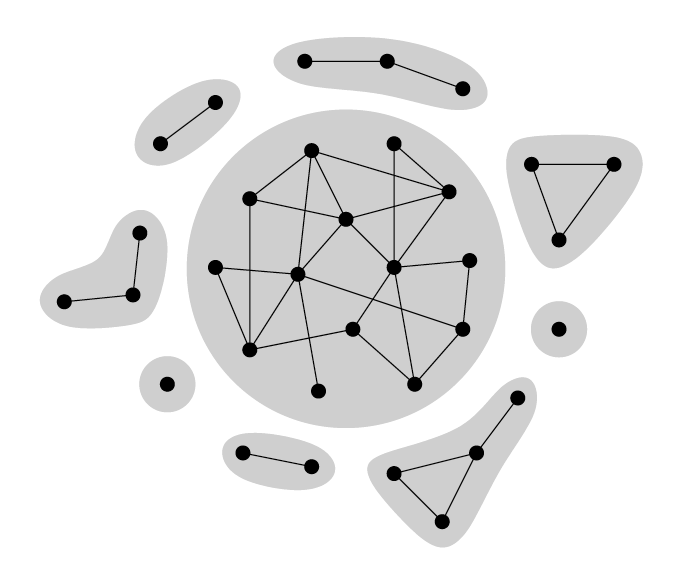
Community detection
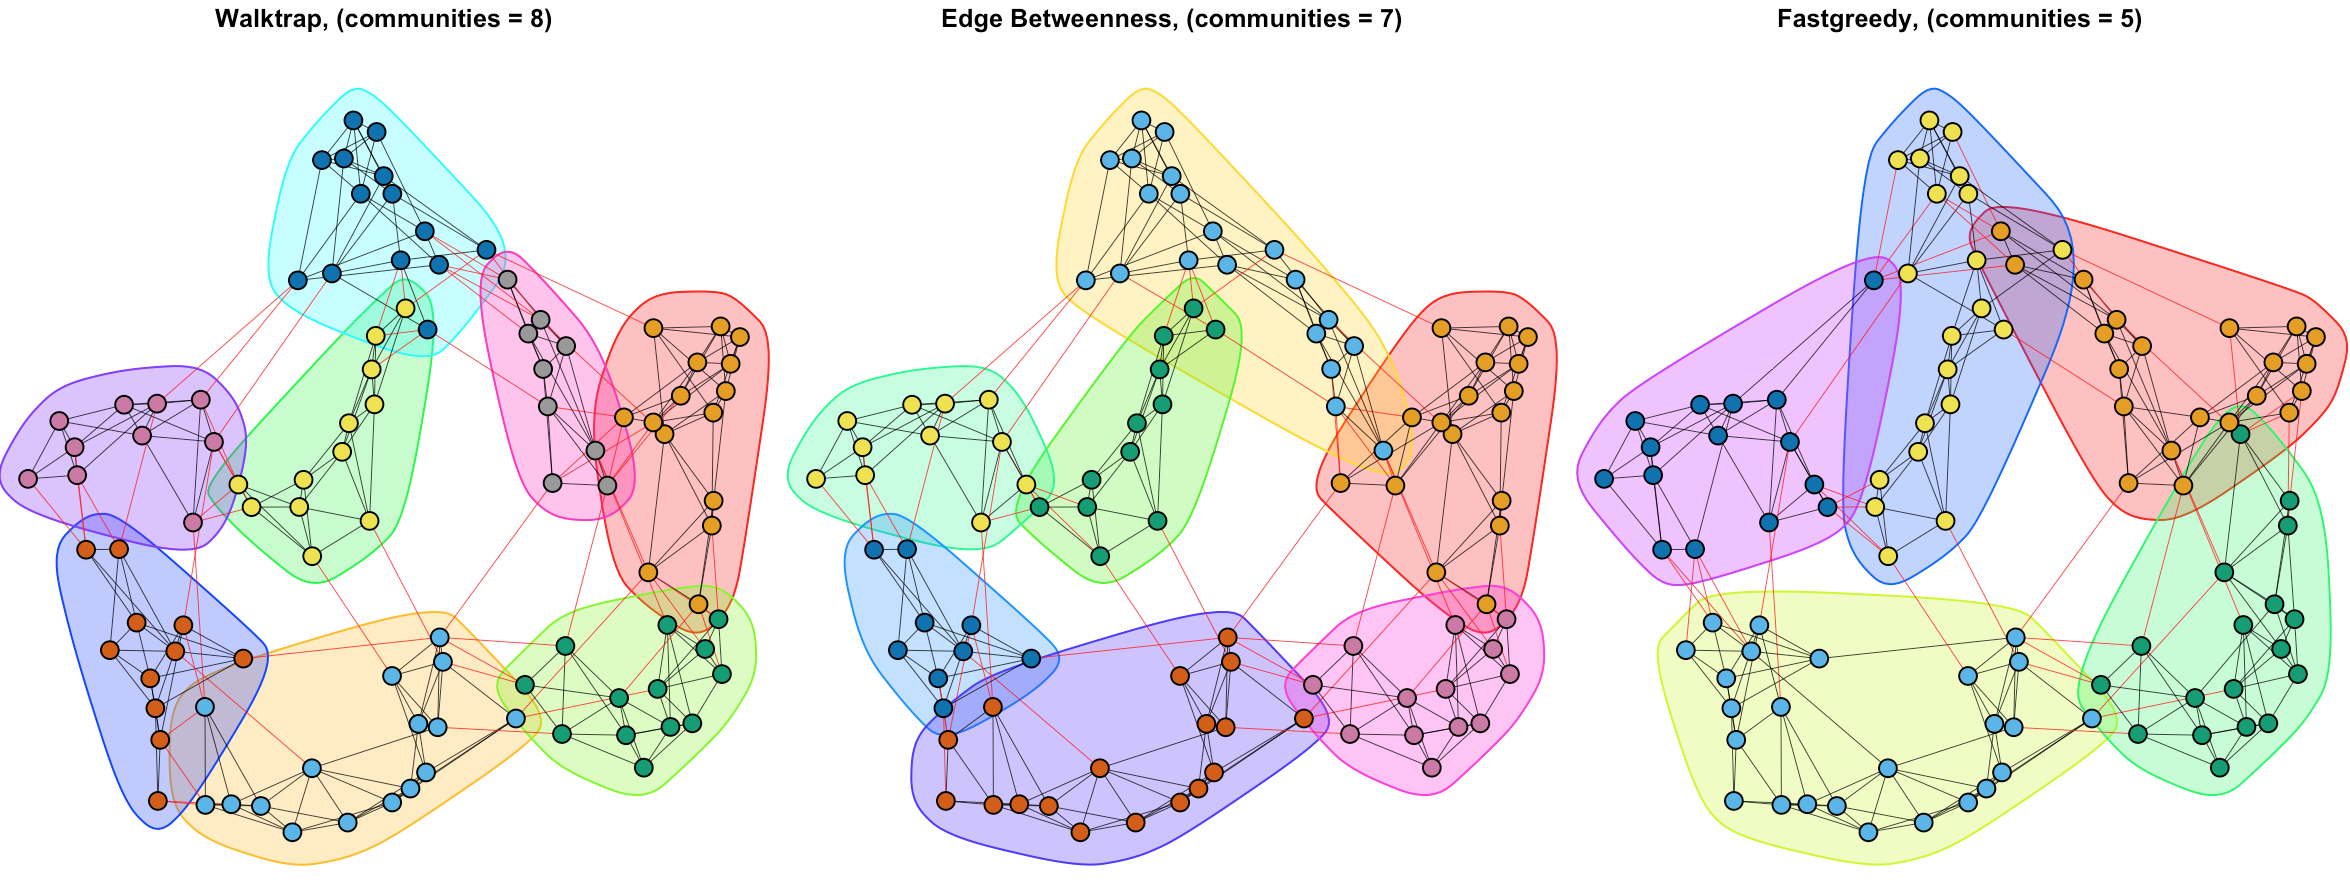
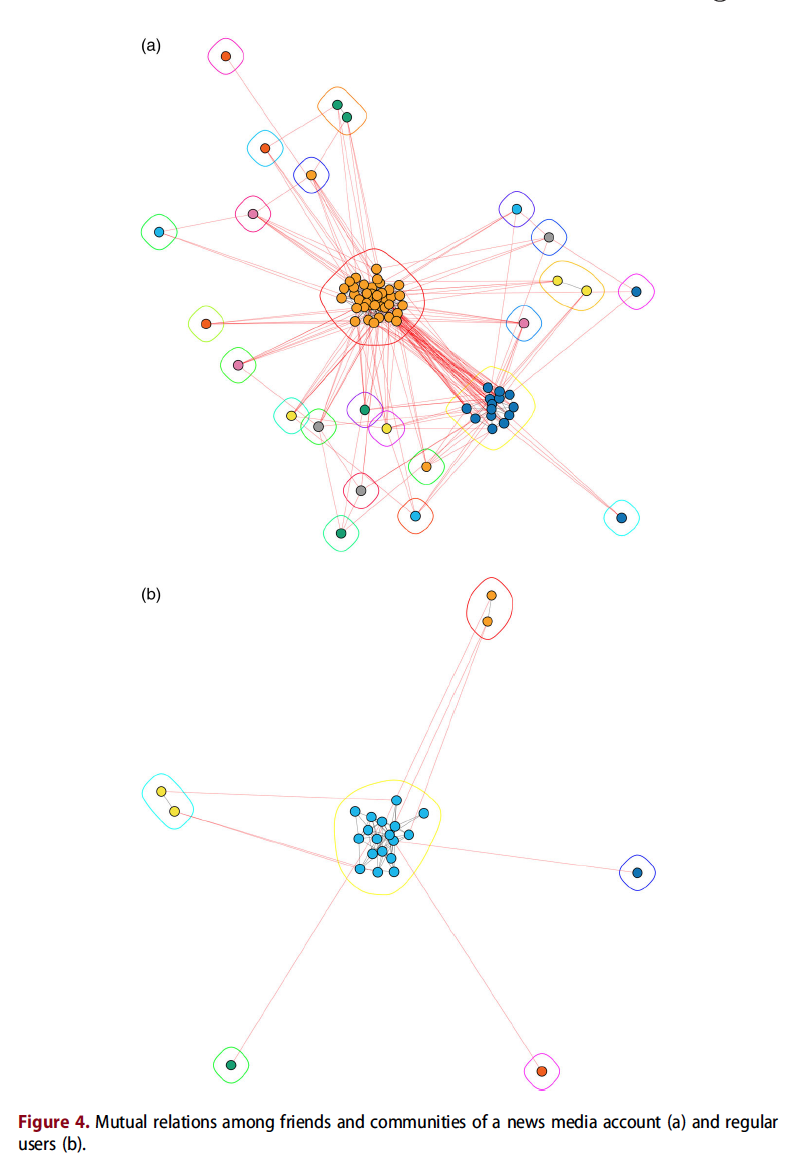
The goal of a community detection algorithm is simply to separate nodes into groups that have only a few edges between them and many edges within.
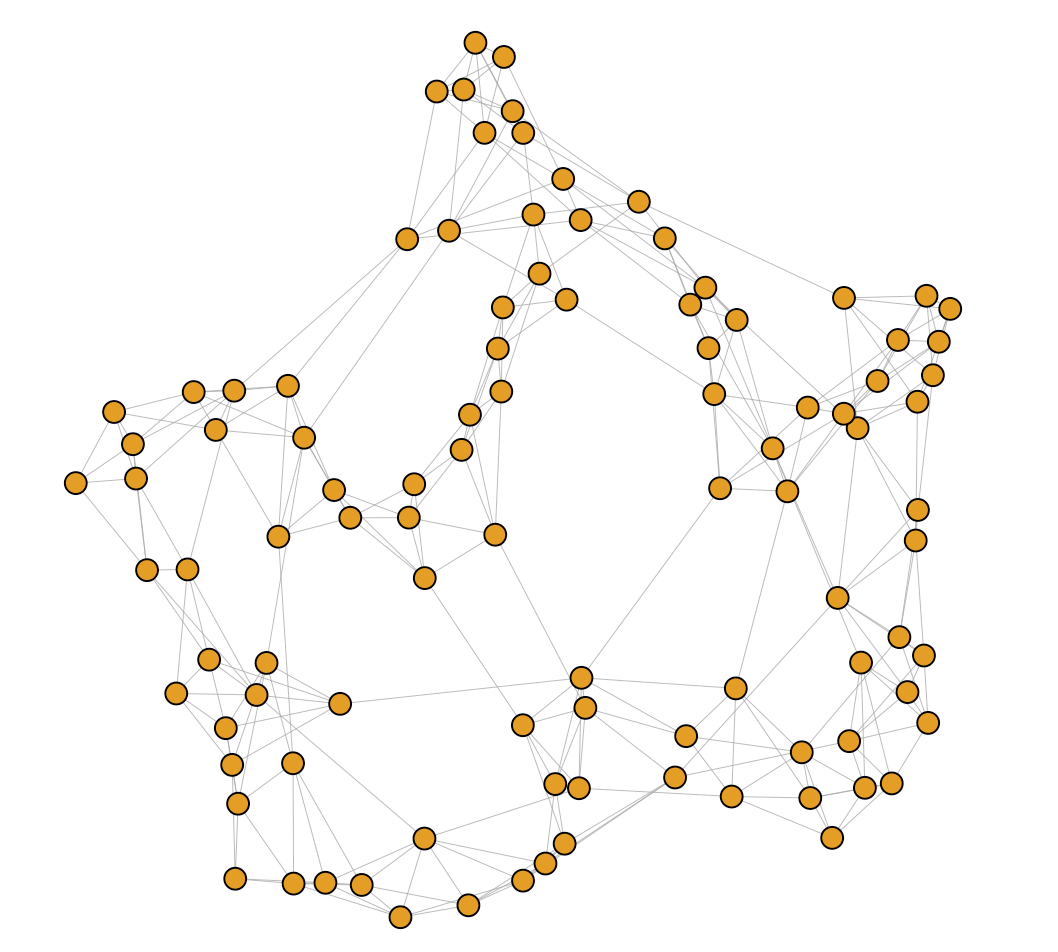
Community detection exercise
How many communities do you see in this network?
Community detection result
Research example

Tools for network analysis
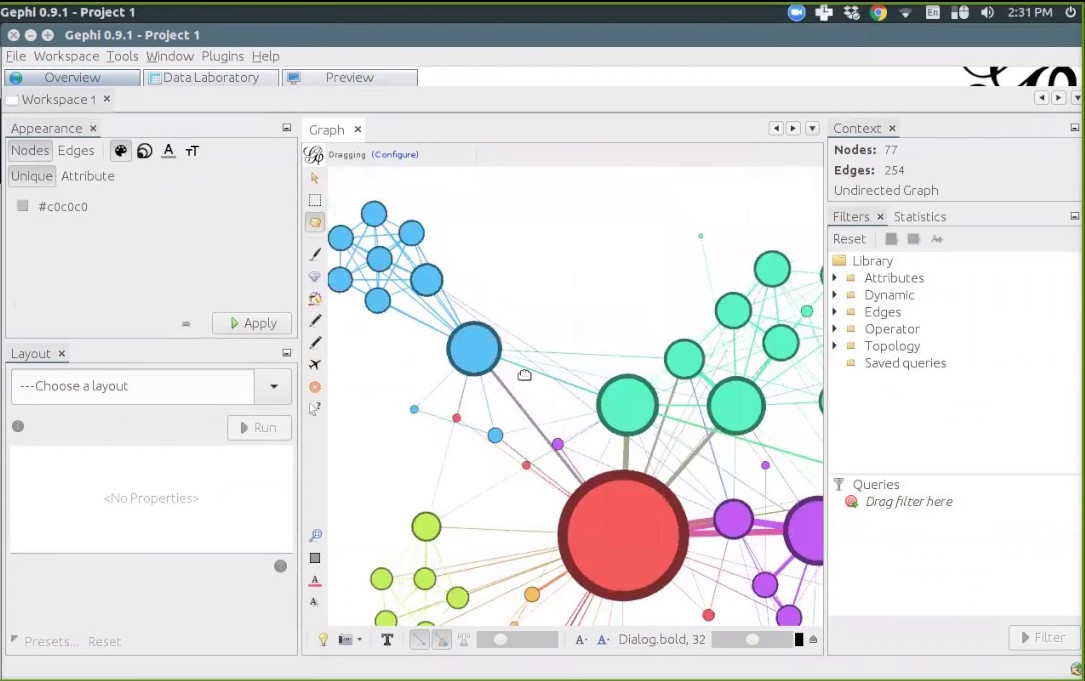
Easy, small n: Gephi (gephi.org)
Tools for network analysis (continued)
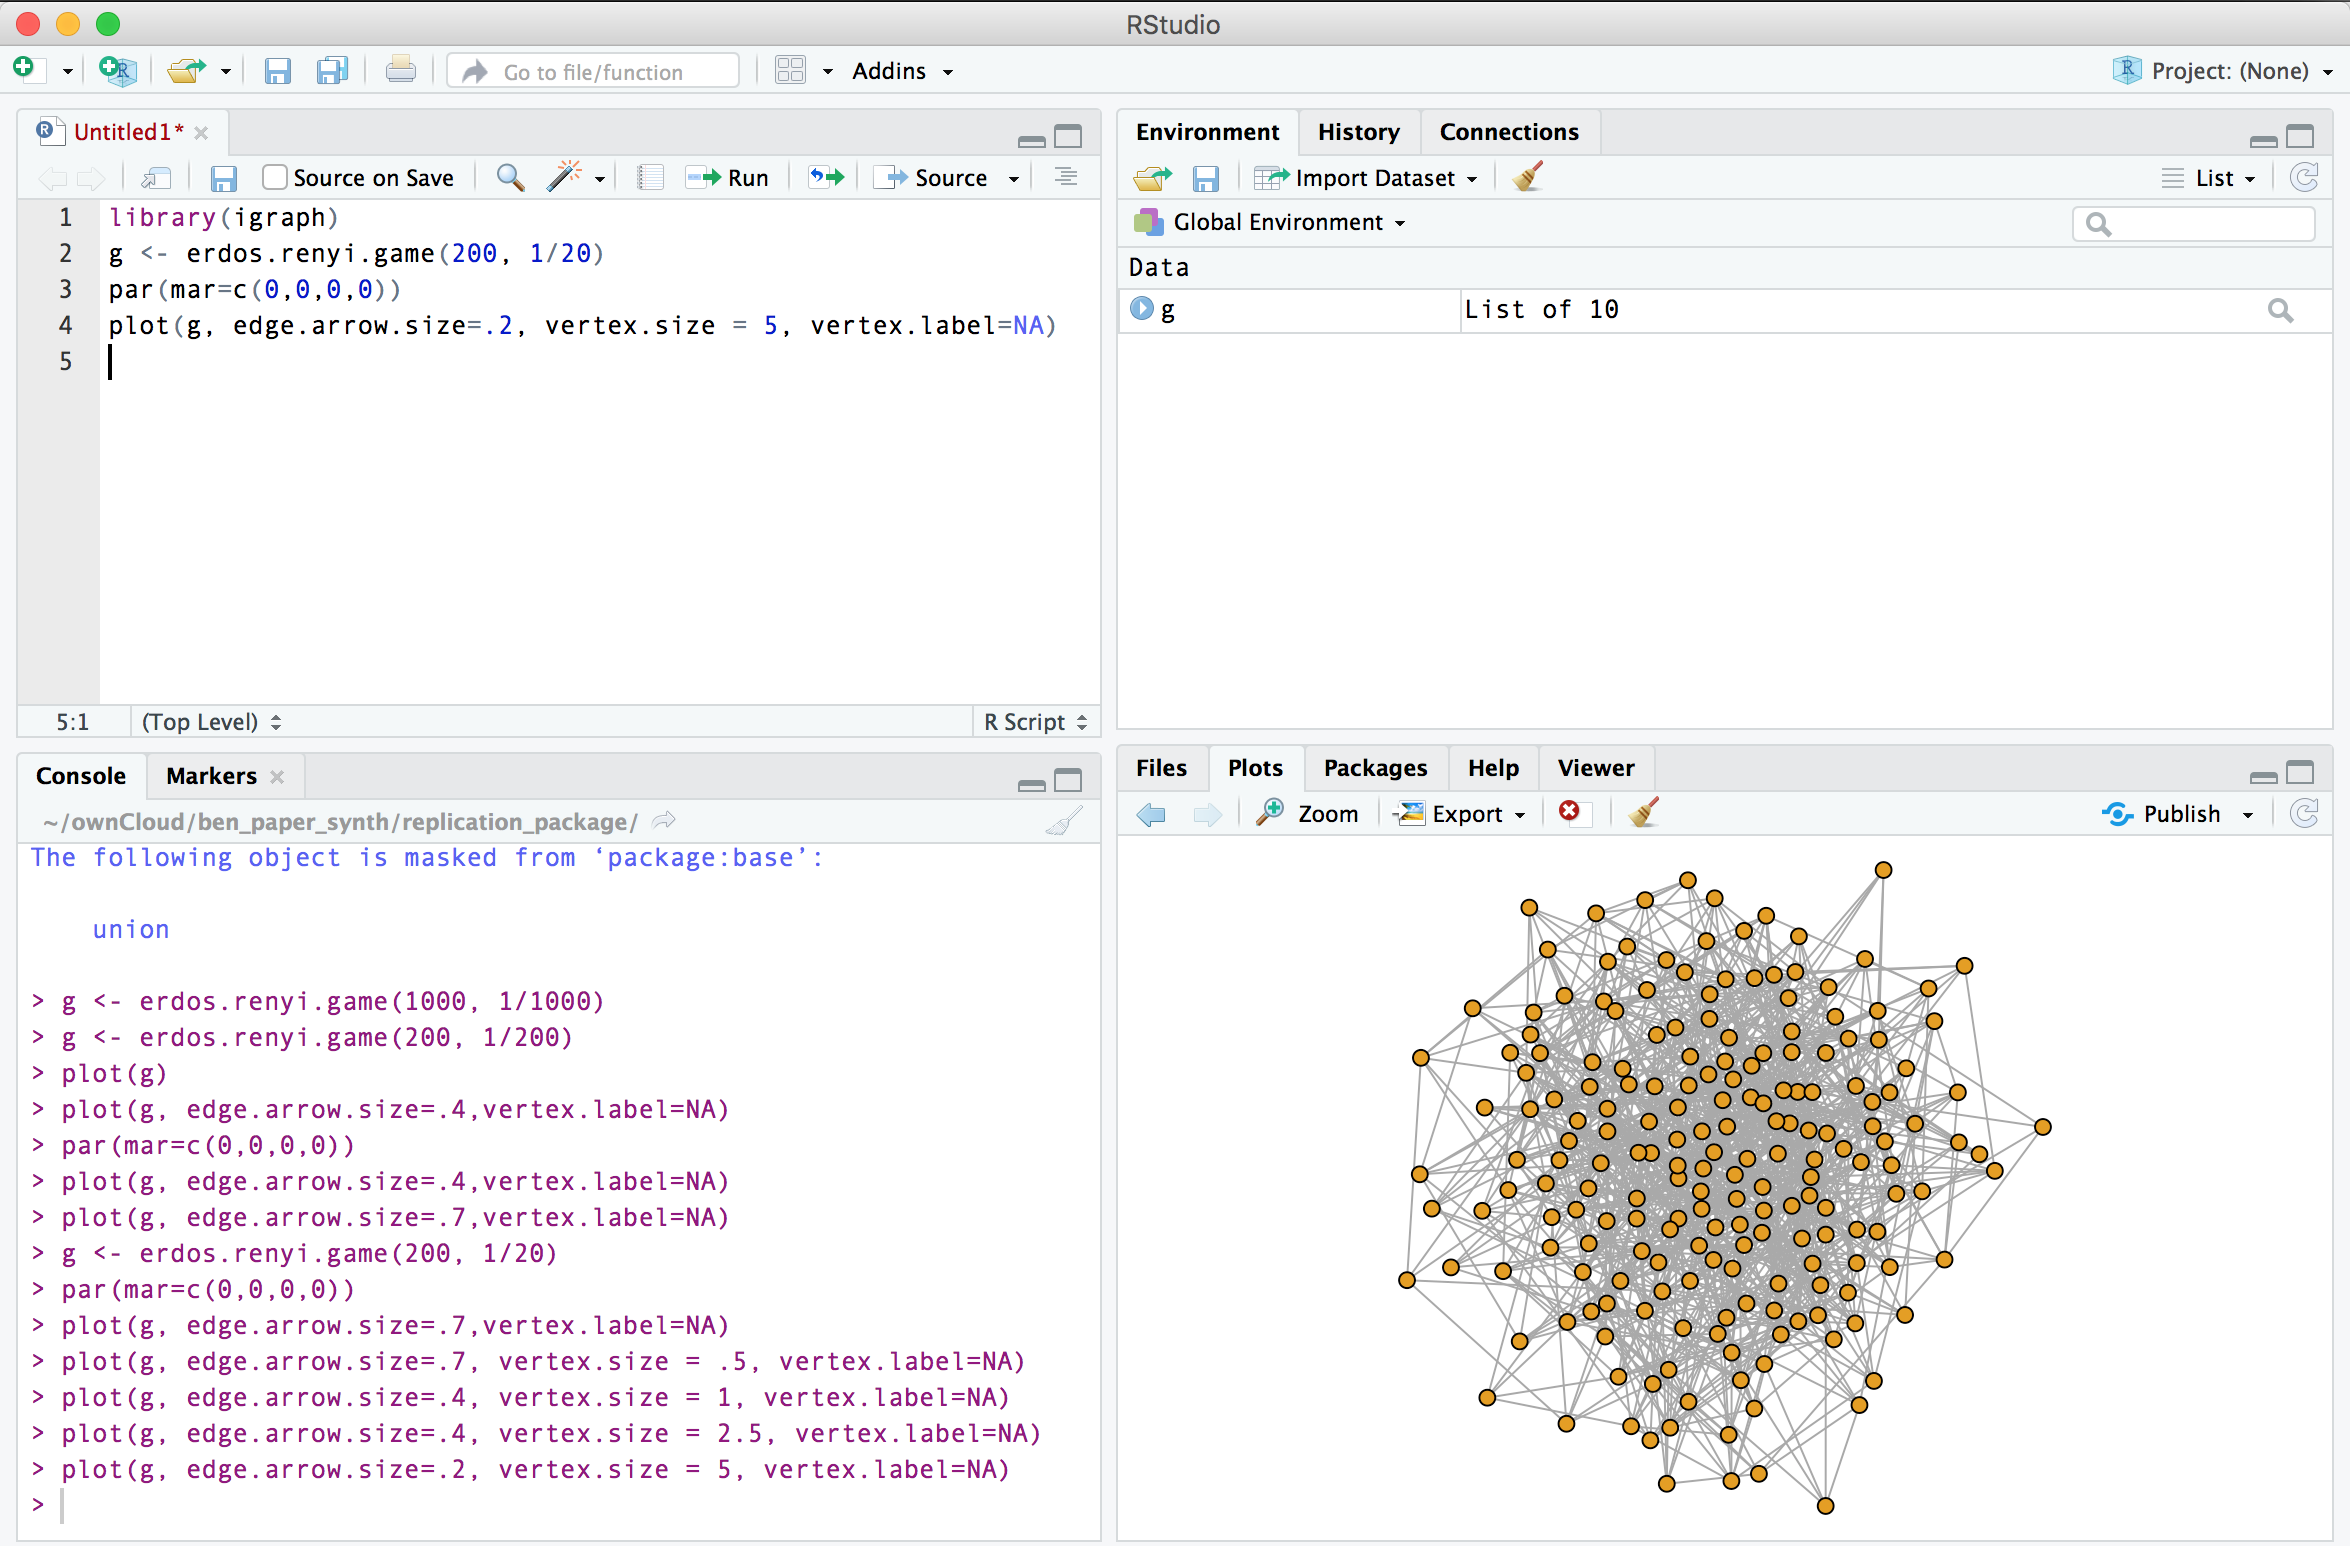
Hard, big n: igraph package
igraph (igraph.org) in R (www.r-project.org) or Python (www.python.org)
Resources for network analysis
Getting started bibliography:
Tutorials for beginners
Tutorials for beginners by Katherine Ognyanova (Rutgers University):

- Network visualisation with Gephi (kateto.net/sunbelt2016)
- Network visualization with R (kateto.net/network-visualization)
- Network Analysis and Visualization with R and igraph (kateto.net/networks-r-igraph)
Text analysis
Another very short introduction
Quantitative text analysis is necessary when the manual coding of documents is not feasible or acceptable.
When you face a large corpus of documents, you might want some methods to automatically:
Find patterns within the documents,
Compare (and maybe group) documents.
Finding patterns
A textual pattern is as simple as dog.
Finding patterns doesn’t involve any statistical analysis.
But you might need to use regular expressions (a.k.a. “regex”) if your pattern is complex.
Finding patterns: Example
Let’s say that you want to find in your corpus all the instances of dog and cat.
You want to find: “I have two dogs and a cat” or “Cats are felines”
But you don’t want to find: “the categorization of syntactic categories”
You need a regular expression like:
\b(cats?|dogs?)\b
Finding patterns: Regex basics
A few simple regex topics:
- Quantifier:
?abc?matches a string that has “ab” followed by zero or one “c”
- OR operator:
|a(b|c)matches a string that has “a” followed by “b” or “c”
- Boundaries:
\b\babc\bmatches only a whole word
Exercise: Go to regexr.com/3os9b (not with Explorer) and enter a regular expression to match “France” but also “French”.
Comparing documents
Comparing documents involves statistical analysis and matrix algebra (while finding patterns doesn’t). It usually relies on Natural-language processing (NLP), the branch of computer science that studies the human language and its interactions with the machines.
In its most primordial application, NLP treats documents as bag-of-words (BoW):
- The position of terms within the document is disregarded,
- What counts is the frequency of the terms.
Comparing documents: Processing steps
Let’s see how we process documents in a common NLP application.
We remove from the documents all the stop-words;
doc1 = “drugs hospitals doctors” doc2 = “smog pollution environment” doc3 = “doctors hospitals healthcare” doc4 = “pollution environment water”
We count the frequency of each term in each document, and we produce a term-document matrix
Comparing documents: Term-document matrix
| doc1 | doc2 | doc3 | doc4 | |
|---|---|---|---|---|
| doctor | 1 | 0 | 1 | 0 |
| drug | 1 | 0 | 0 | 0 |
| environ | 0 | 1 | 0 | 1 |
| healthcar | 0 | 0 | 1 | 0 |
| hospit | 1 | 0 | 1 | 0 |
| pollut | 0 | 1 | 0 | 1 |
| smog | 0 | 1 | 0 | 0 |
| water | 0 | 0 | 0 | 1 |
Bag of Words (BoW)
- Concept: Text representation as a bag of its words, ignoring the order.
- Representation: Fixed-length vectors, counting word occurrences or indicating presence/absence.
- Advantages: Simple, good for specific tasks like spam detection.
- Limitations: Ignores context and semantics, leading to sparse, high-dimensional vectors.
Embeddings (used by Large Language Models)
- Concept: Dense, low-dimensional vectors representing words, capturing semantic meanings.
- Representation: Continuous vectors that reflect context and relationships between words.
- Advantages: Captures semantics, reduces dimensionality and is versatile for various NLP tasks.
- Limitations: Requires more computational resources, less intuitive.
Tools for text analysis
Nvivo (www.qsrinternational.com/nvivo)
Regular Expression (regexr.com)
R (www.r-project.org) or Python (www.python.org)
ChatGPT and other Large Language Models…
Resources for text analysis
Ethics
Issues with relational data
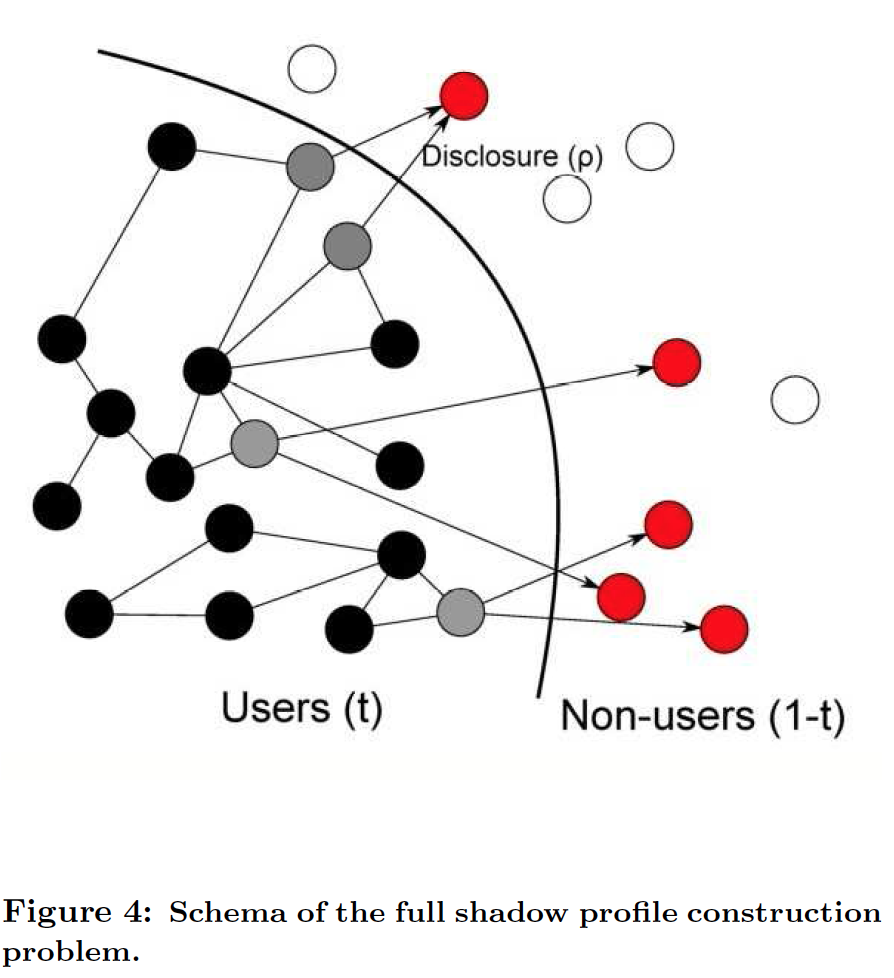
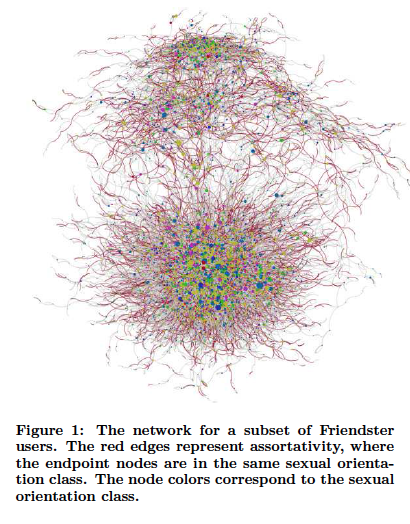
Ethics in the digital age: Open issues
Public and Private space. What about online fora (e.g. Facebook public pages?)
Informed consent.
Right to privacy. But who owns the data?
My research on social media
Recent publications
Slipping to the extreme
Kong et al. (2022)
- This study addresses the infiltration of extreme opinions in online discussions, leveraging machine learning algorithms alongside qualitative research methods.
- Aims to bridge the gap between depth of qualitative insights and breadth of quantitative analysis in understanding problematic online speech.
Methodology
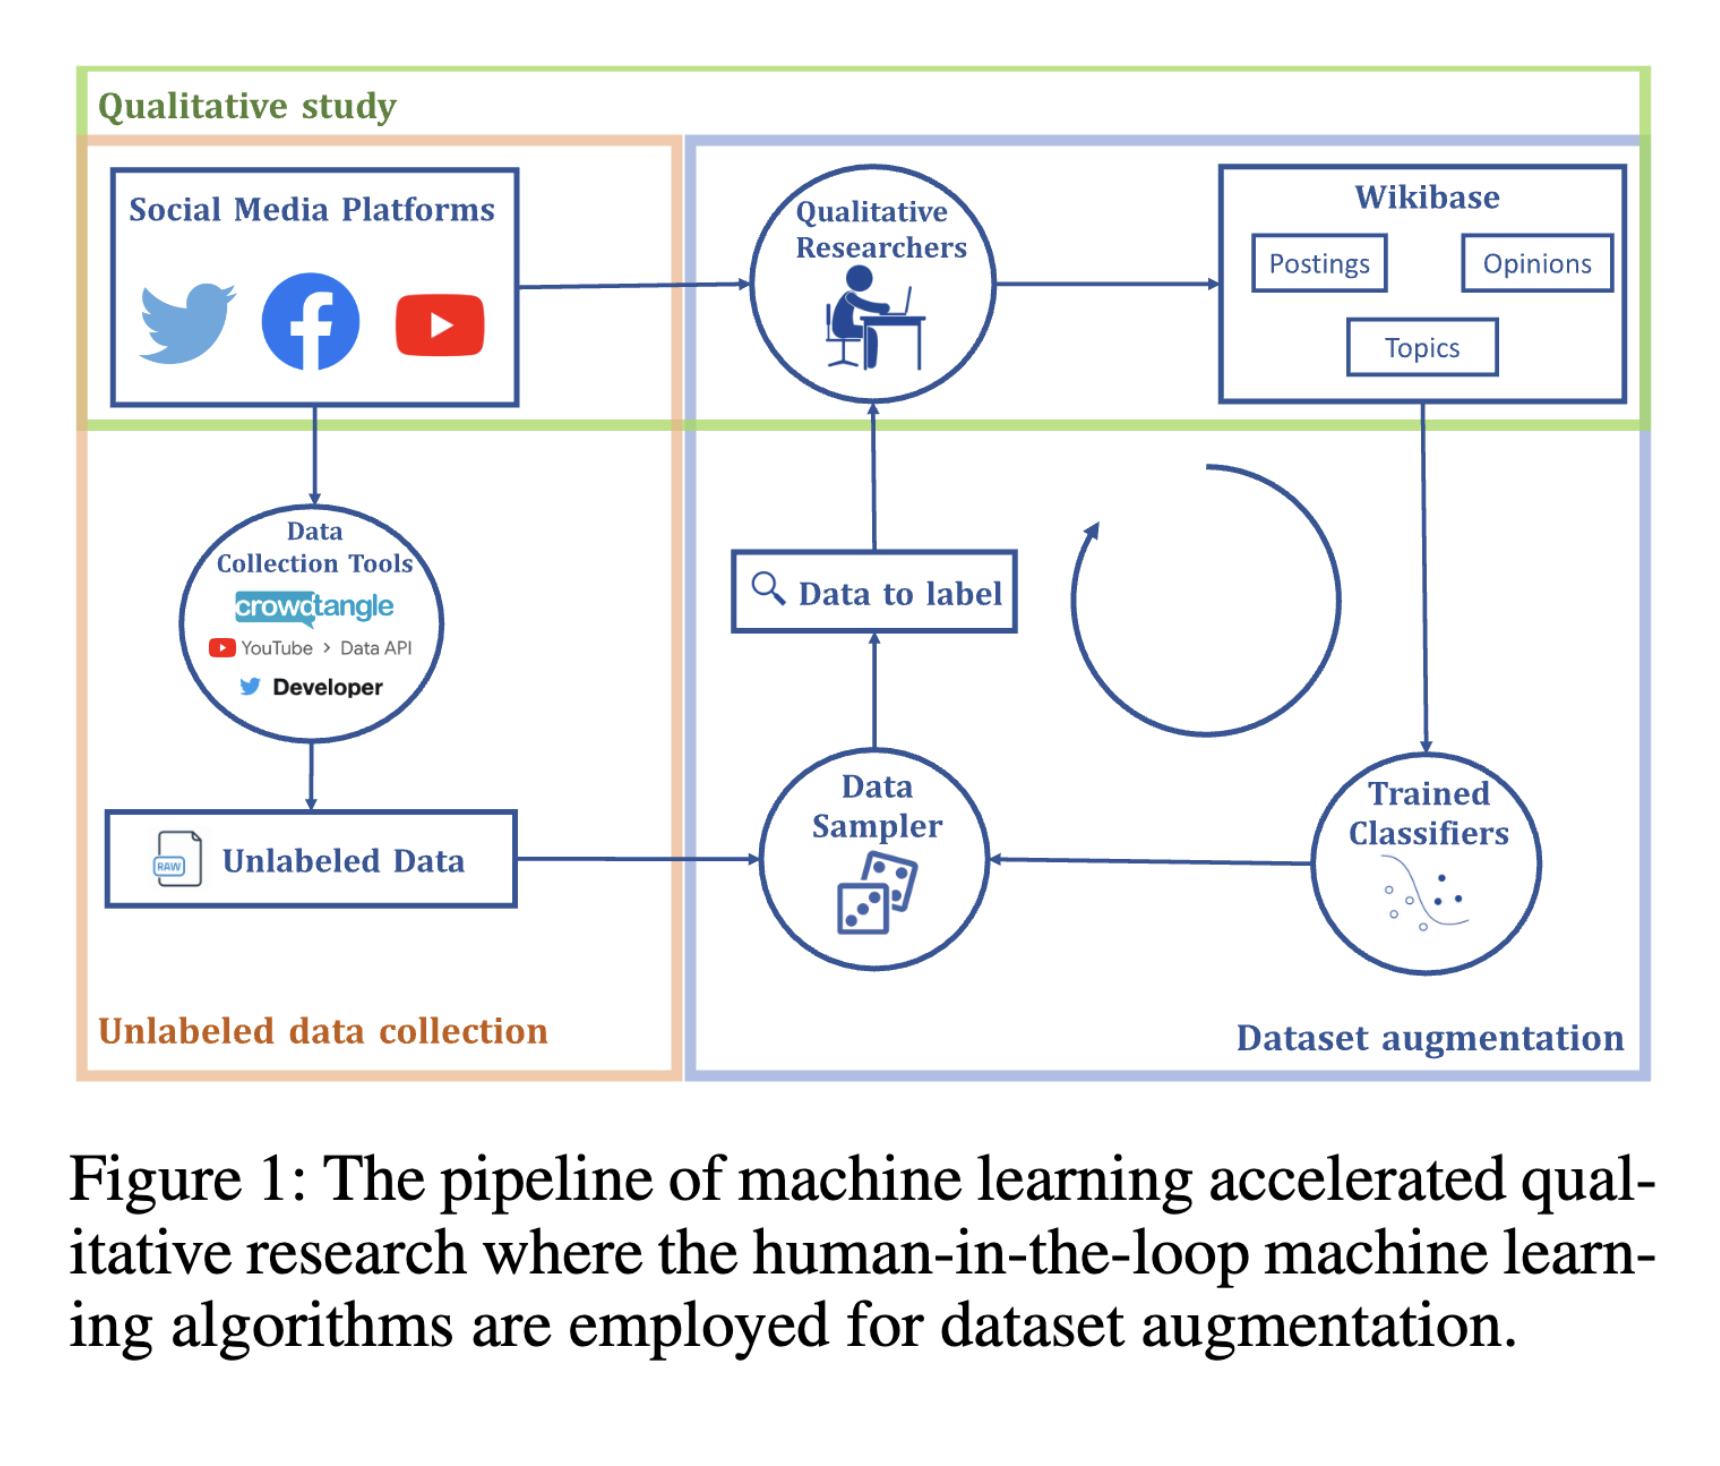
- Initial qualitative study constructs an ontology of problematic speech, identifying key themes and opinions in social media posts.
- Large-scale data collection from Facebook, Twitter, and YouTube, followed by iterative dataset augmentation using a human-in-the-loop approach.
- Machine learning models classify and augment the dataset, expanding the initial qualitative study’s findings.
Research diagram
Findings
- The mixed-method approach successfully identifies and expands the dataset, revealing detailed case studies of problematic speech dynamics in specific online communities.
- Analysis of opinion emergence and co-occurrence suggests pathways through which extreme opinions enter mainstream online discourse.
Labelling, shadow bans and community resistance
Johns et al. (2024)
- Focus on the effectiveness of Meta’s content moderation on Facebook during COVID-19.
- Analysis of 18 Australian right-wing/anti-vaccination pages between January 2019 and July 2021.
- Integration of engagement metrics, time series analysis, and content analysis.
Sampling
- Utilised CrowdTangle to collect data from 21 identified Australian Facebook public accounts.
- Final analysis included 18 accounts after excluding those with less than 1% of relevant posts.
- A total of 34,202 postings were analysed.
Data Analysis
- Performance analysis via CrowdTangle’s ‘overperforming score’ and average number of shares-per-post.
- Content and thematic analysis on comments from two overperforming public pages.
- Latent Dirichlet Allocation (LDA) for topic modelling and exploration.
Results visualization
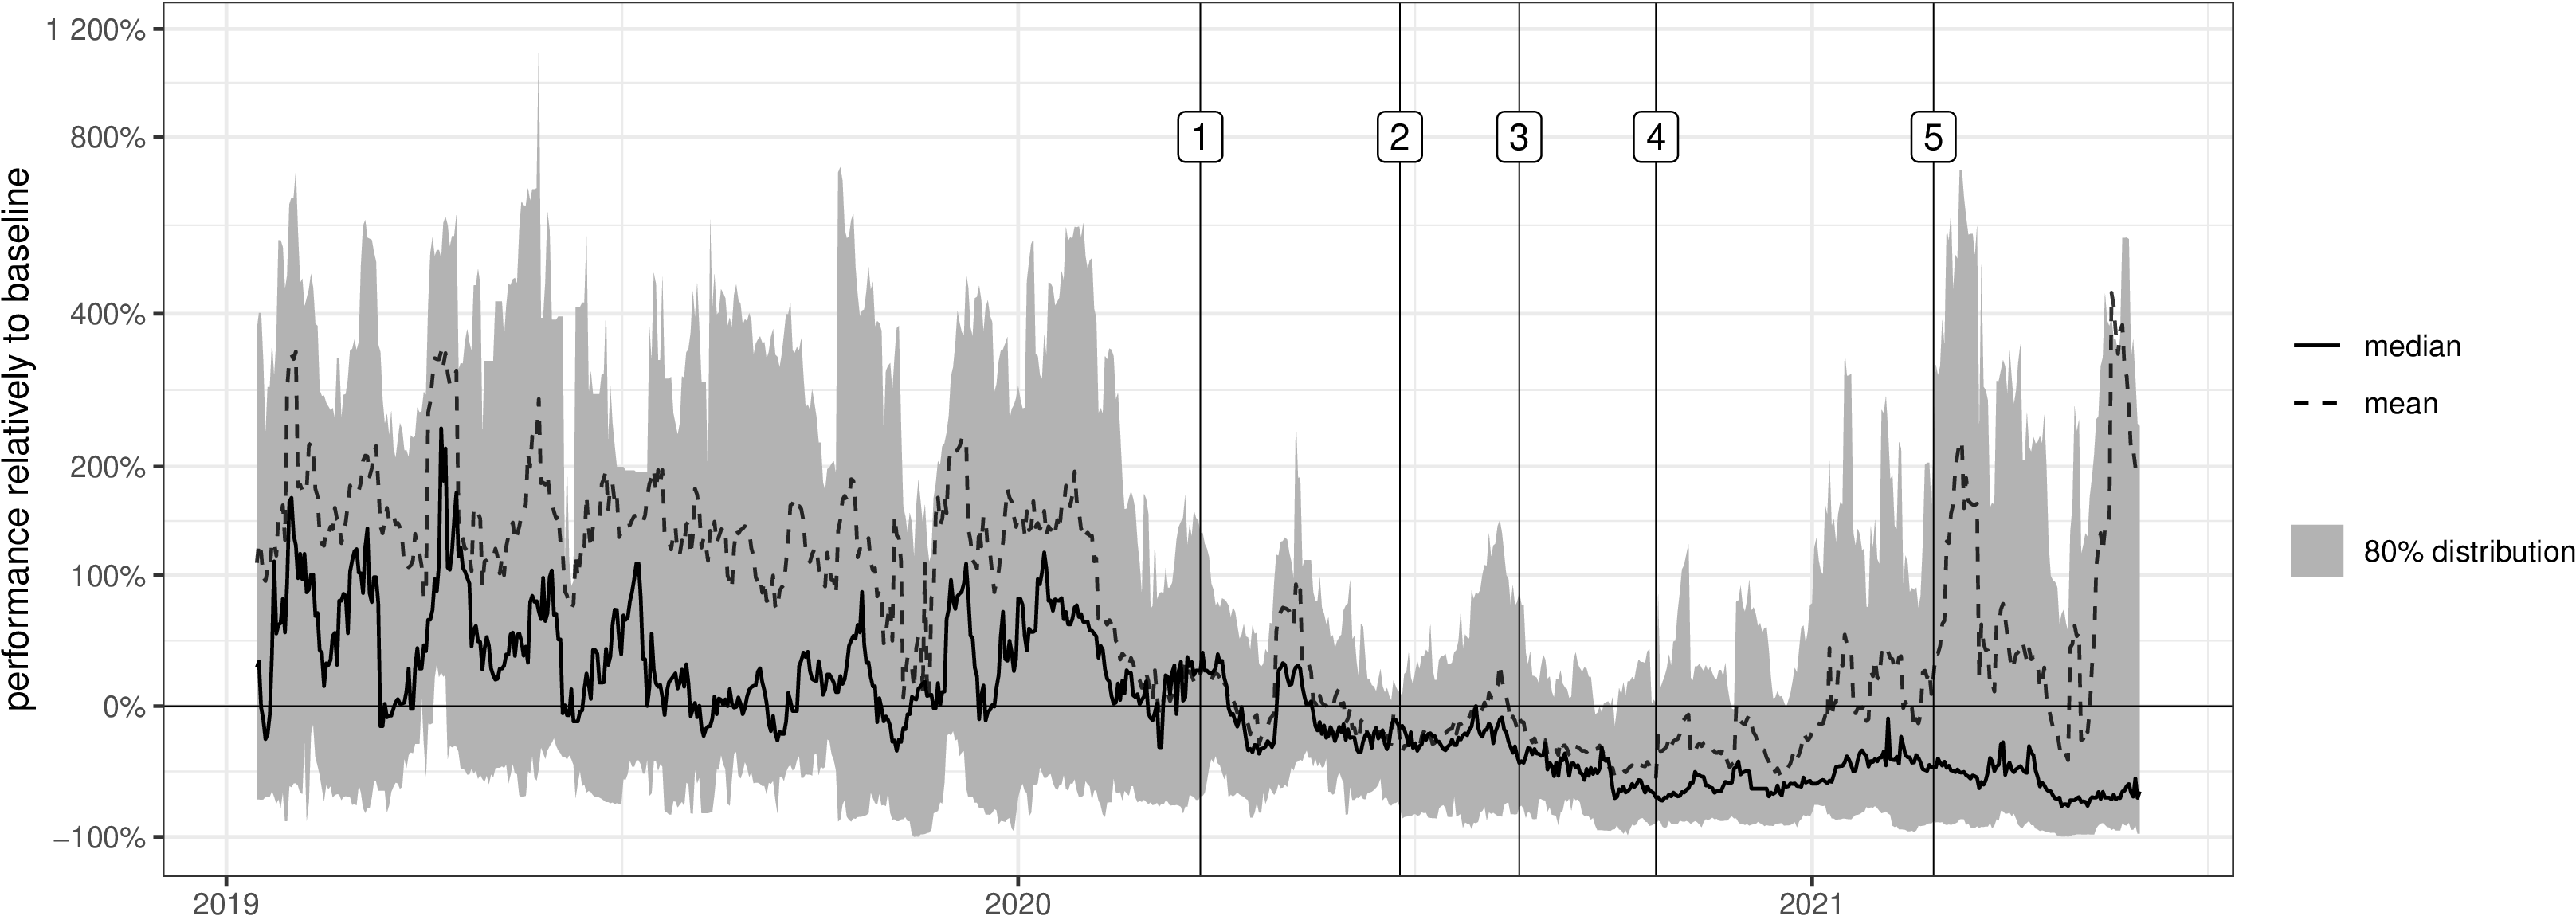
Policy Review
- Examination of Meta’s content moderation and recommendation policy announcements.
- Focus on policies introduced from January 2020 to July 2021 relevant to Facebook.
- Analysis juxtaposed against key policy announcements and page performance.
Key Findings
- Meta’s content moderation systems showed partial effectiveness.
- Identified trends in content labelling and ‘shadow banning’ resistance by communities.
- Highlighted the importance and challenges of transparent and consistent moderation policies.
Bonus: Spatial analysis
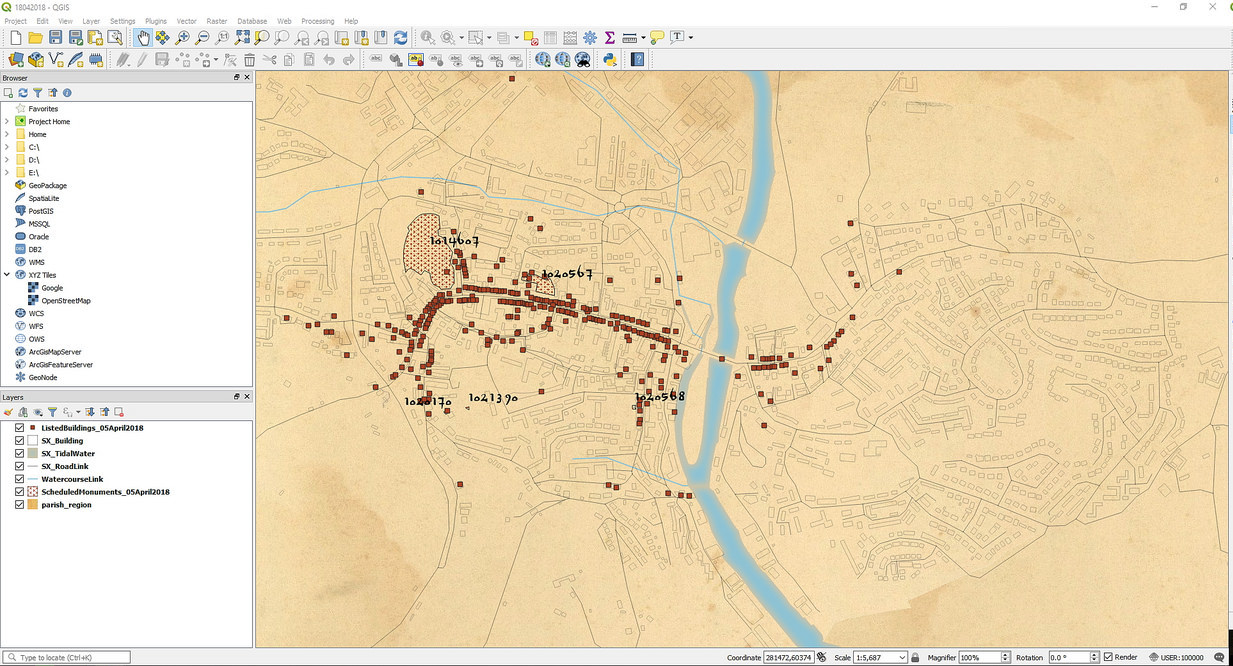
Spatial analysis: John Snow’s cholera map
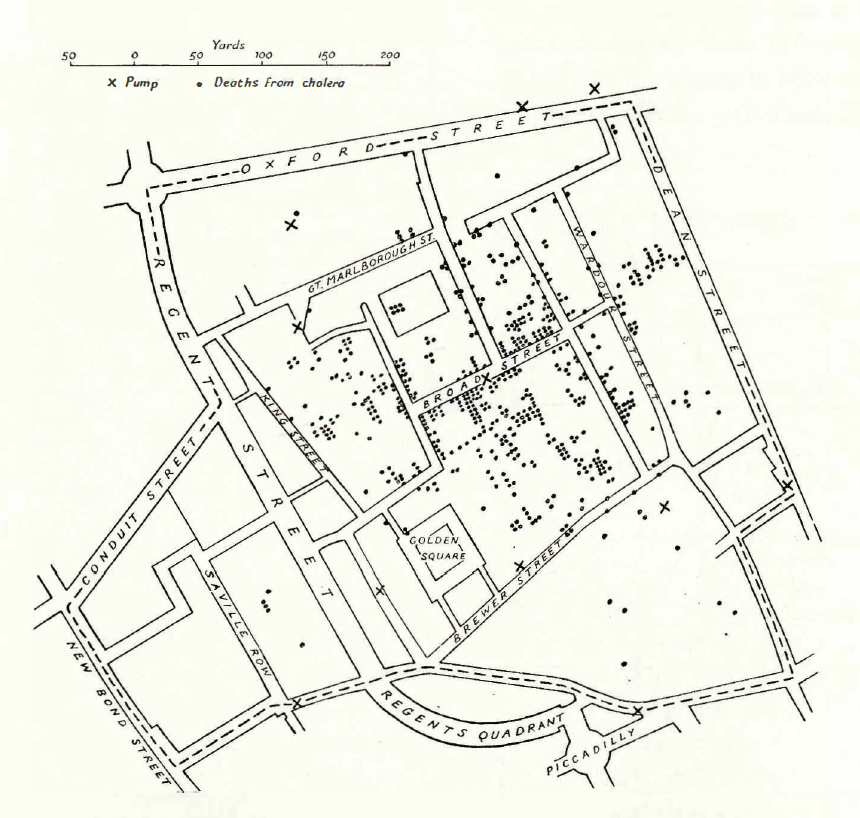
Redrawing of John Snow’s map of cases of cholera during the London outbreak of 1854 (Tufte, 2001, p. 24)
Tool for spatial analysis
- QGIS (qgis.org)